What Is an Image?
Image capture, composition and basic analysis
Session 2 of the Fundamentals of Microscopy workshop 2026
February 26, 2026
Fundamentals of Microscopy workshop - Session 2 What Is an Image? Image capture, composition and basic analysis
Ved Sharma, PhD
Advanced Image Analyst Bio-Imaging Resource Center, The Rockefeller University
![]()
How are images formed in a microscope
https://morgridge.org/feature/fluorescence-imaging-primer/
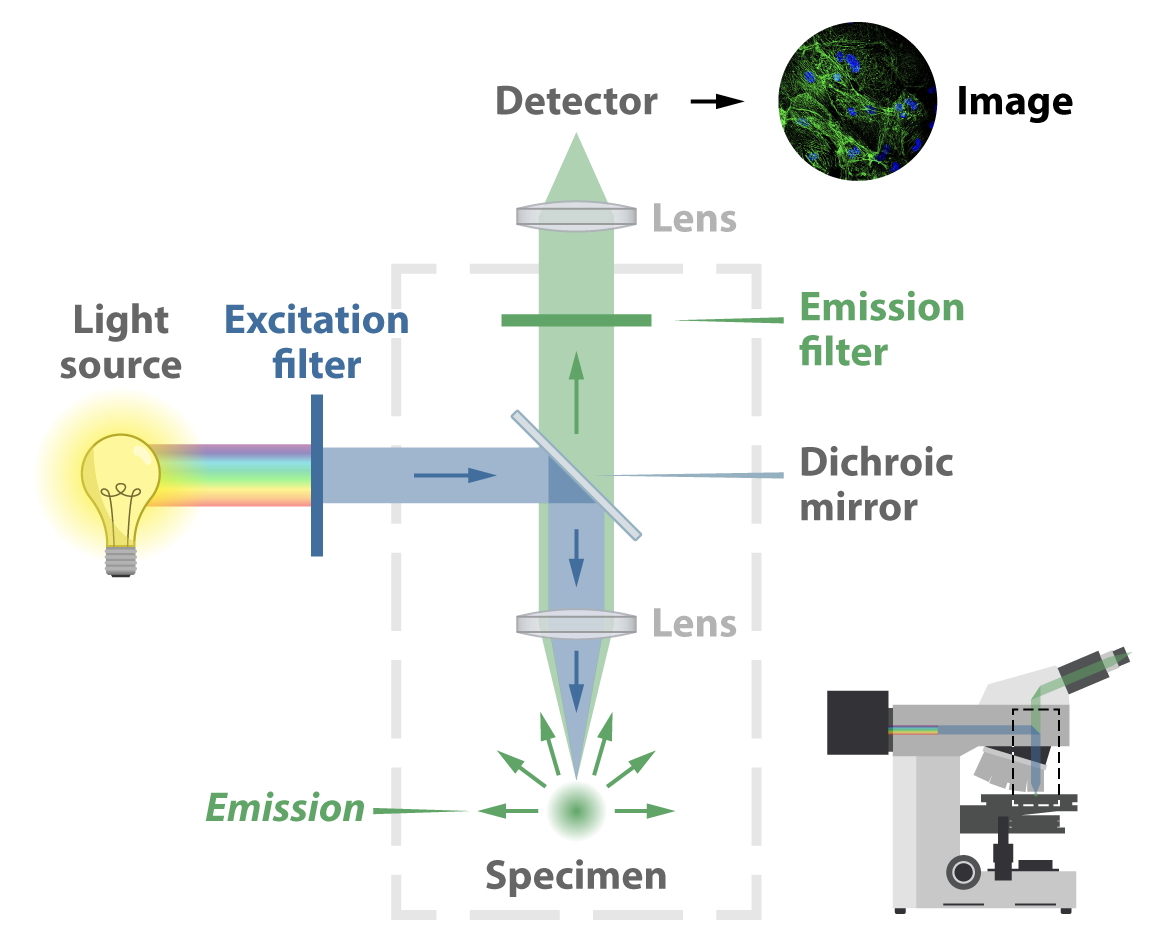
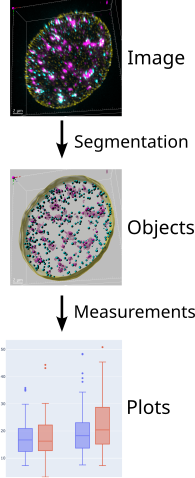
Image Analysis workflow
page 1 drawing from /mnt/bircdata08/home-birc/BIRC/OMIBS Course Binder/08_16_2024_Friday/Luke Lavis/OMIBS_2024_Lavis_Lecture_1.pdf
noise, FFT, PSF: OMIBS_LaRiviere2024.pdf PSF: PSF Quality OMIBS 2024 Turnbull v2.pdf
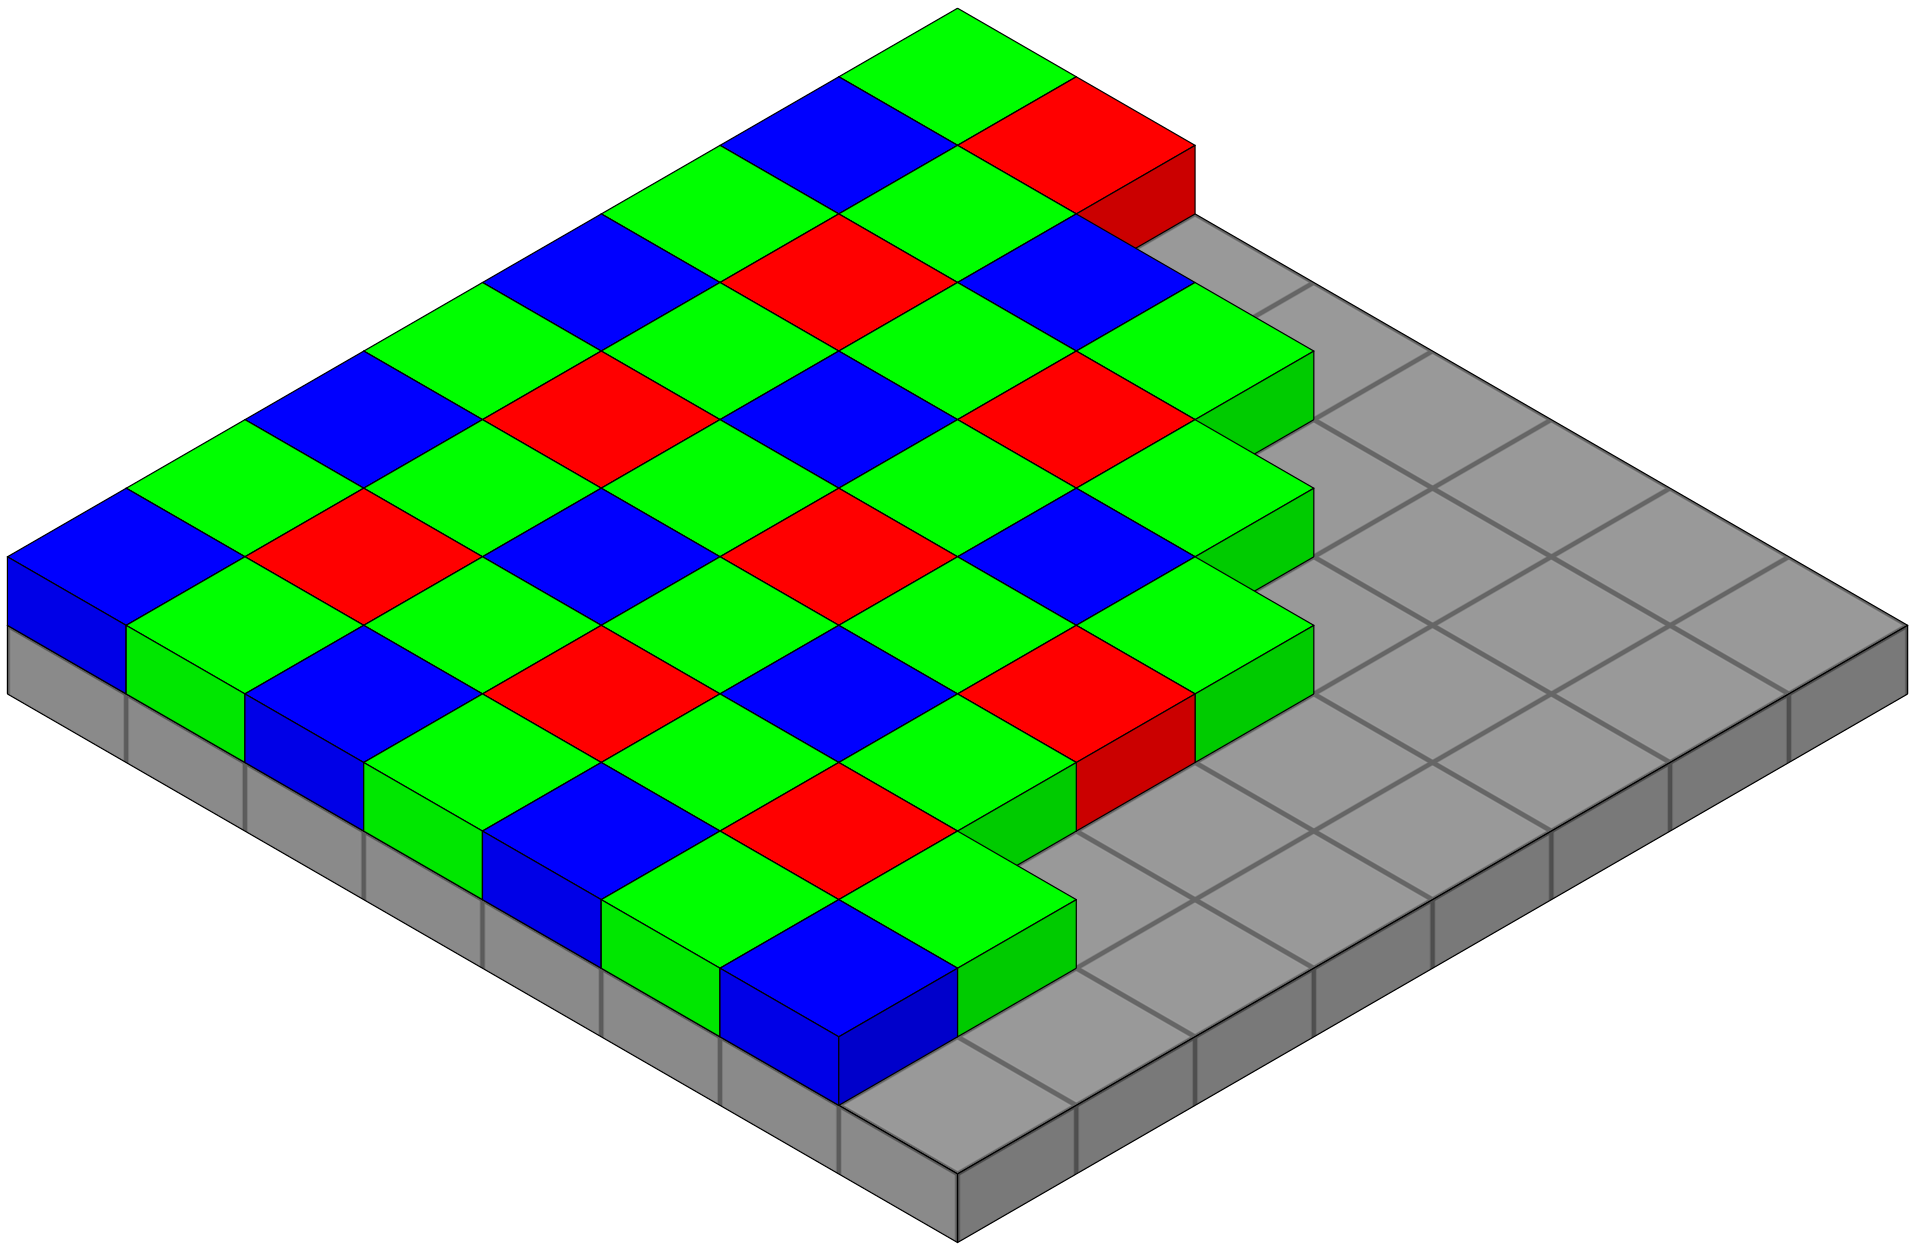
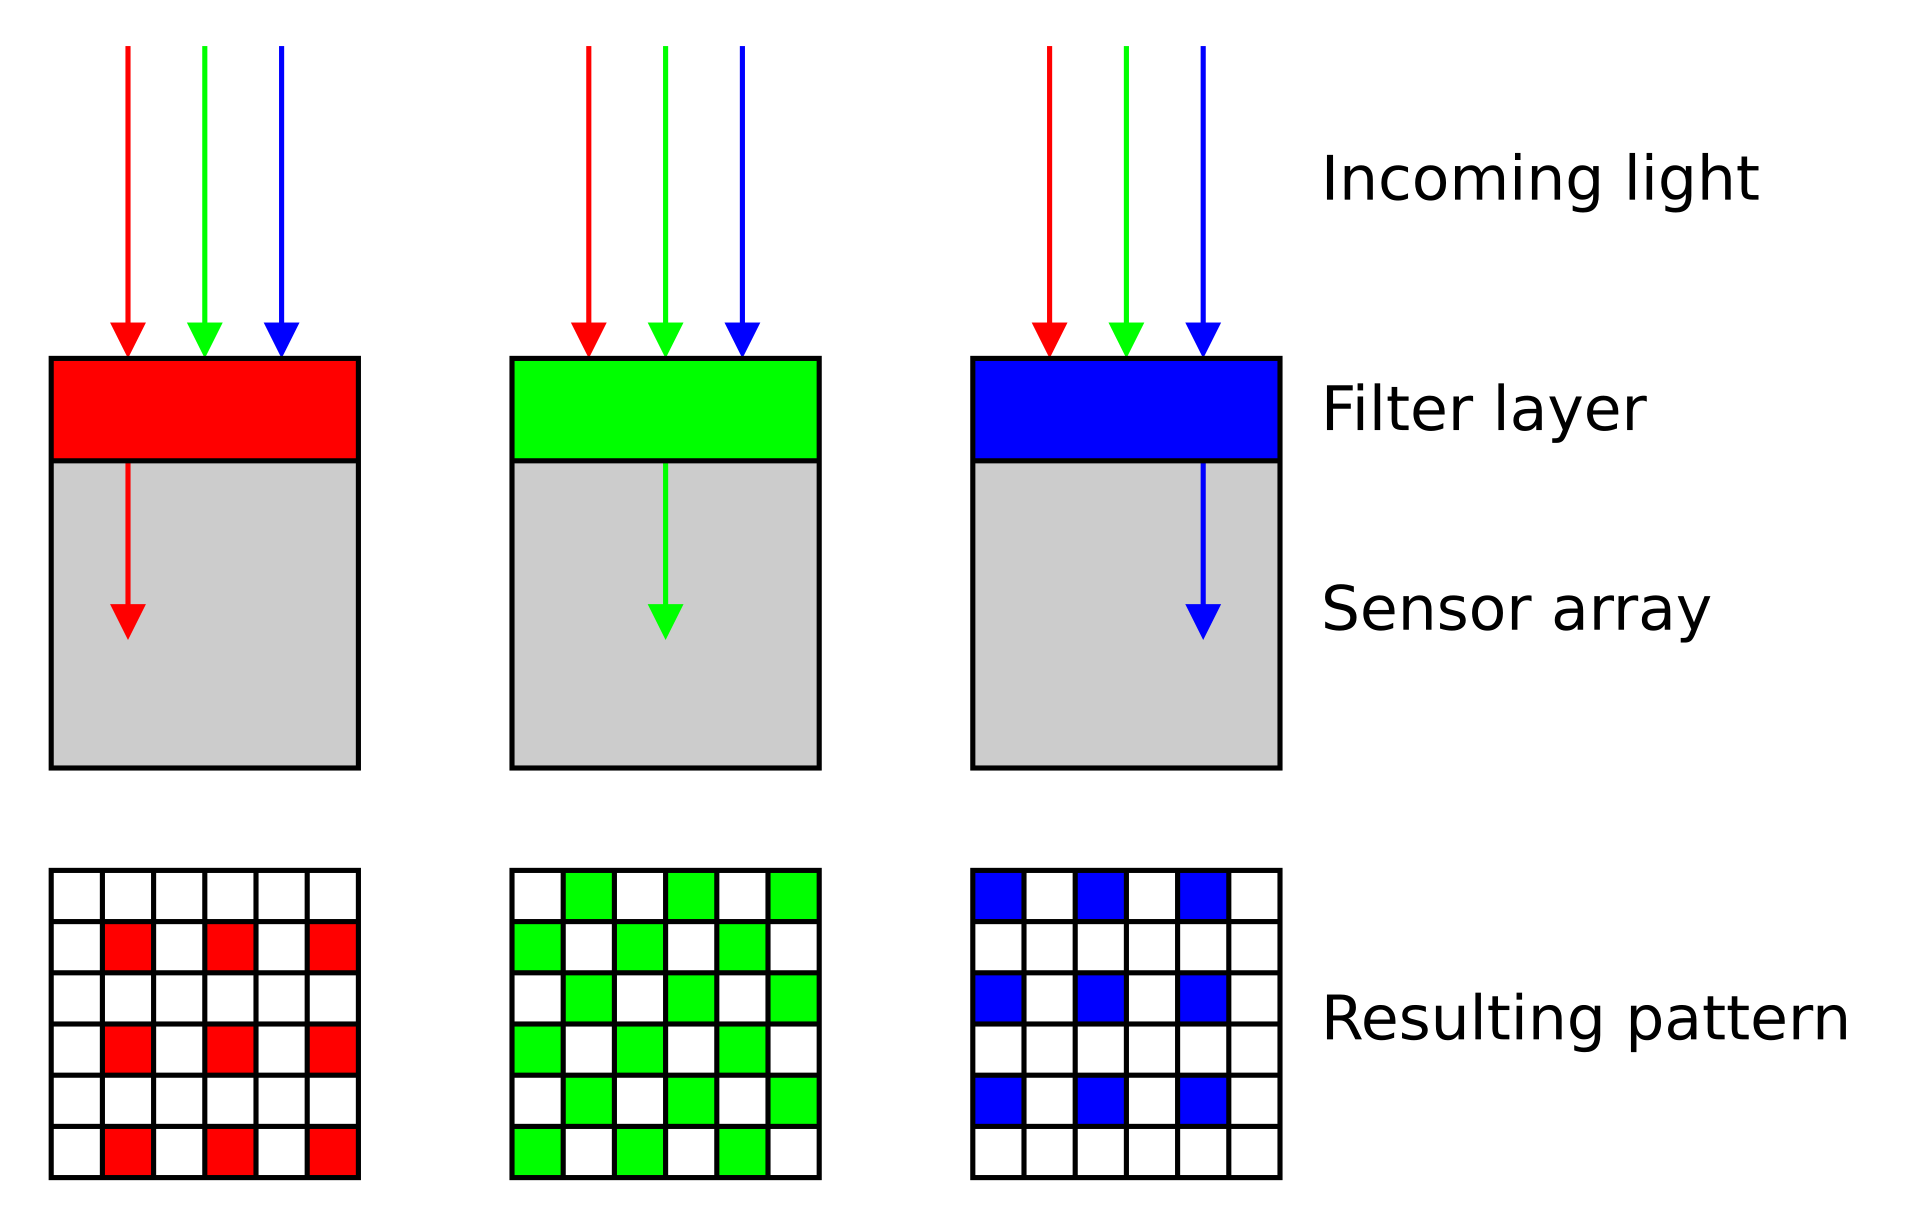
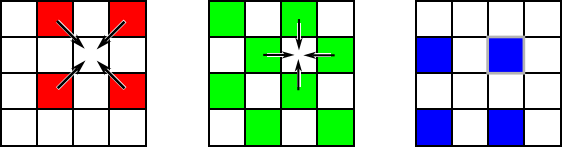
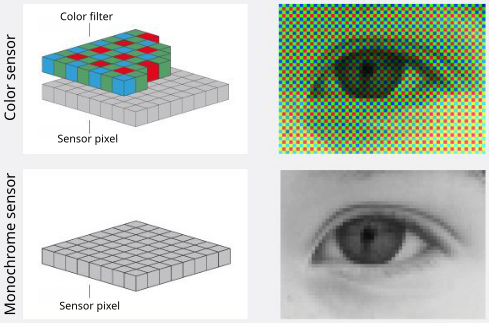
Color camera - Bayer filter array (BFA)
- Bayer filter array (BFA) is a color filter pattern to capture color information.
- It consists of a grid of red, green, and blue filters arranged in a specific pattern over the camera’s sensor.
- Each pixel on the sensor captures light filtered through one of these colored filters
- Interpolation of neighboring pixels generates a smooth representation of a colored field of view.
Monochrome camera
- Each pixel captures the full intensity of incoming light, resulting in higher sensitivity and better signal-to-noise ratio (SNR) compared to color cameras.
- These cameras are used for fluorescence imaging and quantitative analysis, as they provide more accurate intensity measurements without the need for interpolation.
- Used in combinations with dichroic mirrors and emission filters to capture specific wavelength ranges, allowing for multi-channel imaging and analysis of different fluorophores.
- Used in transmitted-light techniques for better contrast and resolution.
- Used in scientific research and applications where accurate intensity measurements are critical, such as in cell biology, neuroscience, and materials science.
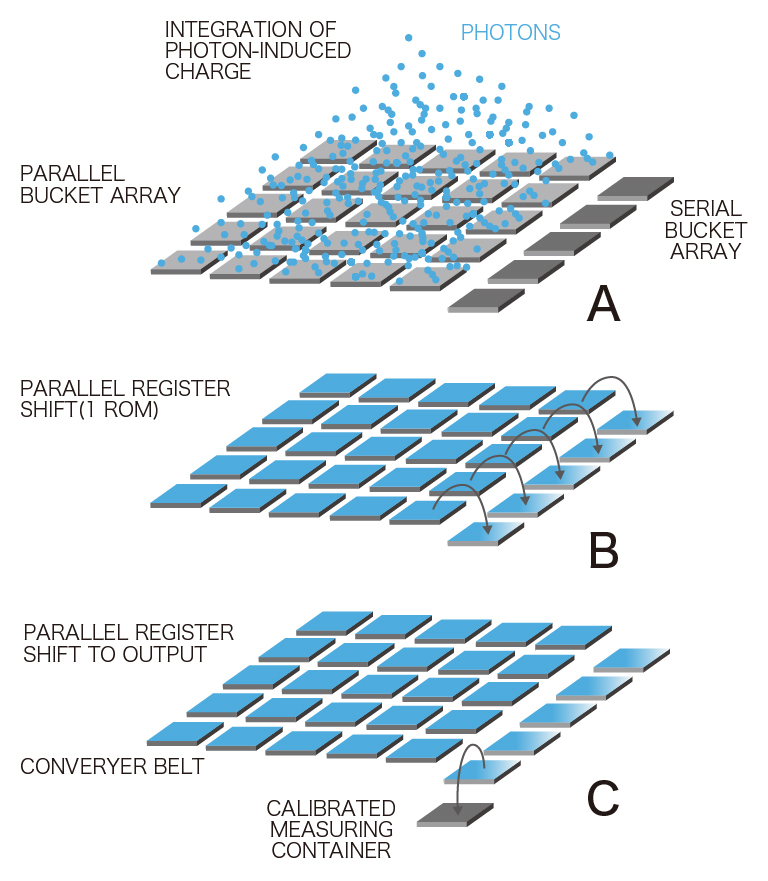
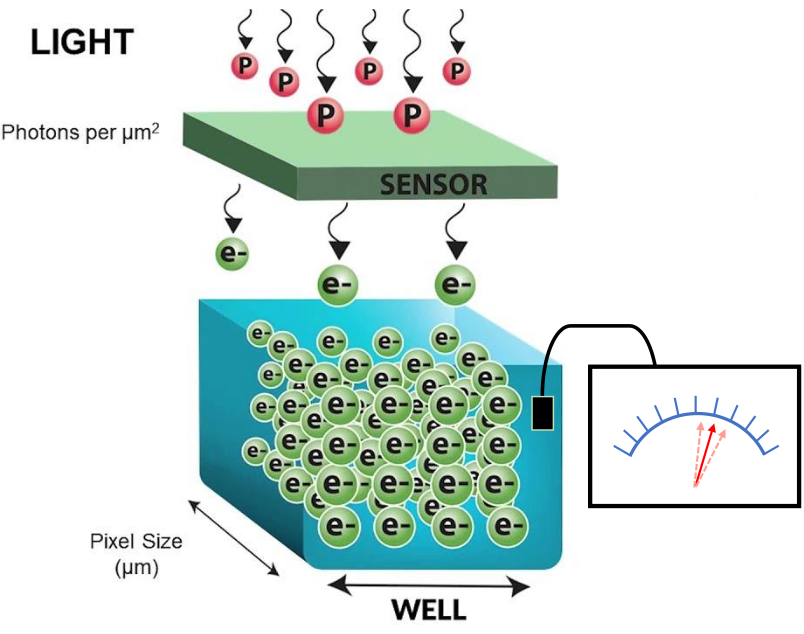
CCD camera
from https://camera.hamamatsu.com
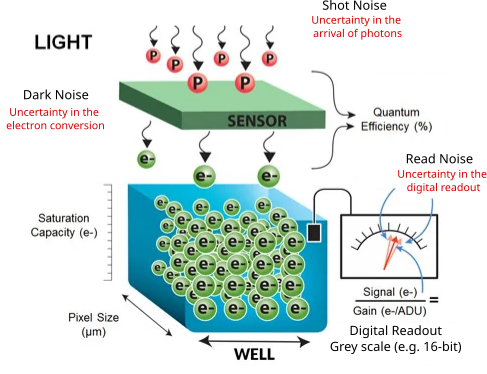
- Each pixel of the CCD image sensor is composed of a photodiode and a potential well, which can be thought of as a bucket for photoelectrons.
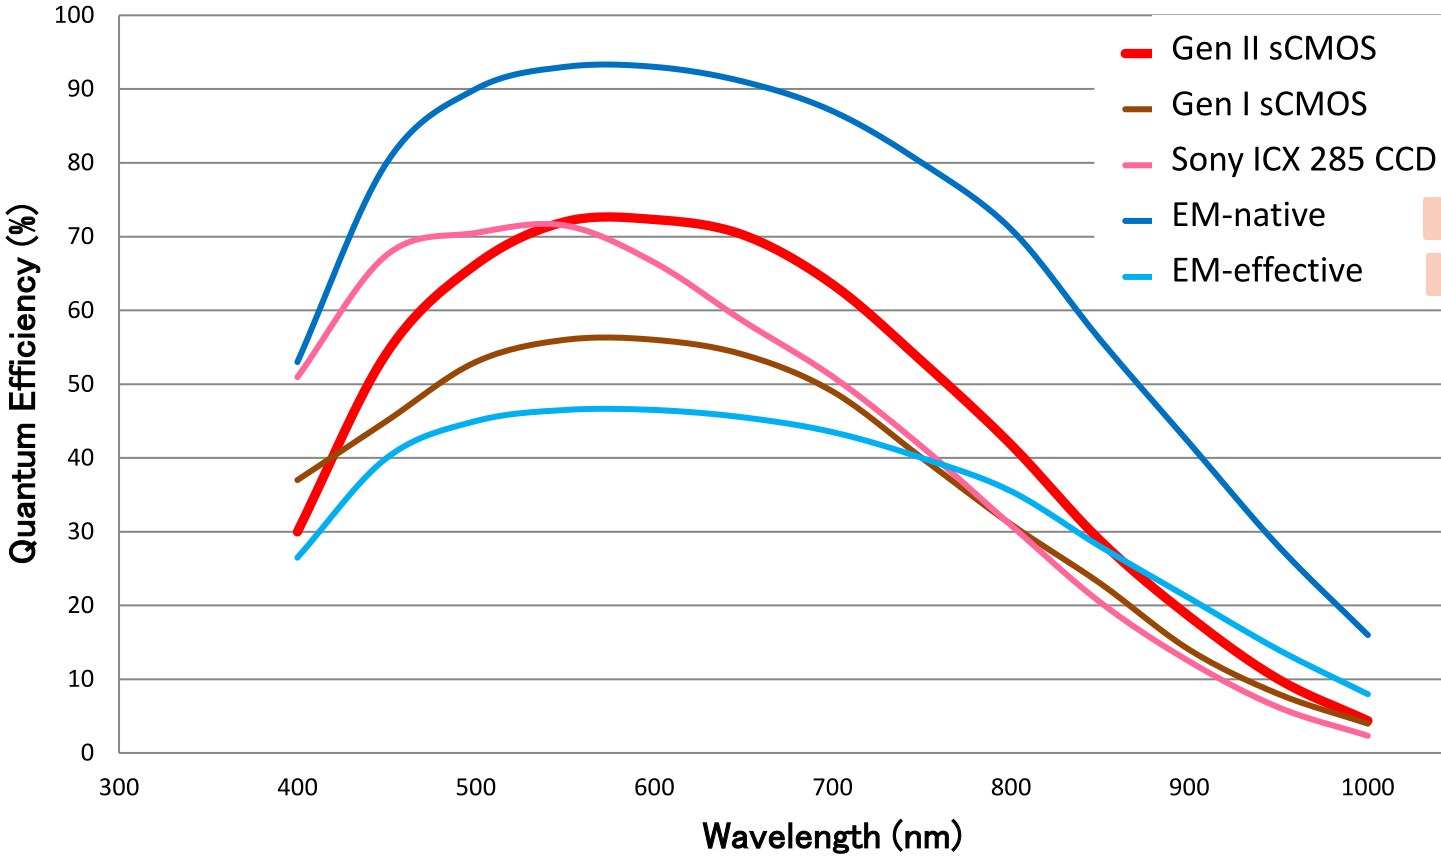
- This wavelength dependent conversion of light to photoelectrons is specified as the quantum efficiency (QE).
- Photoelectrons accumulate in each bucket until it’s time for readout, when all of the photoelectrons are relayed from one bucket to the next down each row of pixels.
- The charge is gathered pixel-by-pixel—serially—into a container at the end of the relay.
- Once in the container, the photoelectrons are converted into voltage and processed into an image on the camera circuit board.
- Because the photoelectrons are converted into signal (voltage) at a common port, the speed of image acquisition is limited.
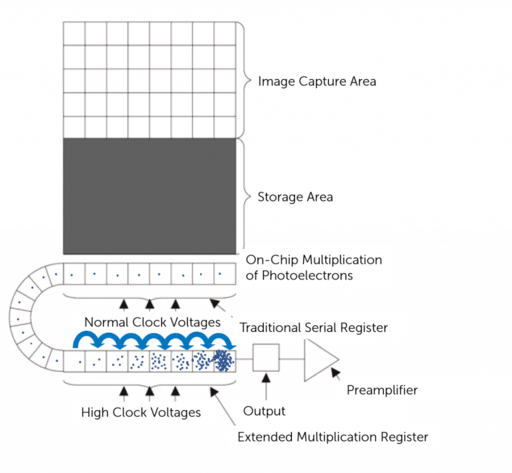
EMCCD camera
https://www.teledynevisionsolutions.com
- Similar to CCD except that they have an on-chip electron multiplication register that amplifies the signal before readout, allowing for detection of very low light levels.
- Because the photoelectrons are converted into signal (voltage) at a common port, the speed of image acquisition is limited.
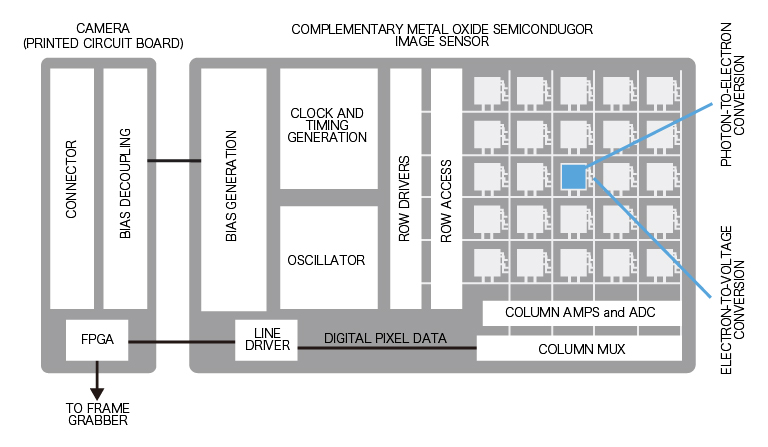
sCMOS camera
https://camera.hamamatsu.com
- In contrast with CCD and EMCCD sensors, each pixel of a CMOS image sensor is composed of a photodiode-amplifier pair.
- Unlike a CCD sensor, photoelectrons are converted into voltage by each pixel’s photodiode-amplifier pair.
- Because conversion to voltage happens in parallel instead of serially (CCD), image acquisition can be much faster for CMOS sensors.
- scientific CMOS sensors combines high QE with fast frame rates and low noise, which translates into high speed, high-resolution biological images, even in low light situations.
- For almost all applications, newer sCMOS cameras are a great choice, but for ultra-low light (single fluorescent molecules) EMCCDs may still be better.
Shot noise
- Uncertainty in the arrival of photons
- Arrival of any given photon is independent and cannot be precisely predicted
- The probability of its arrival is governed by a Poisson distribution
- It is most apparent at low signal levels, where the number of detected photons is small
- Shot noise can be reduced by collecting more photons, either with longer exposure times or by combining multiple frames, but this may not always be feasible due to photobleaching or phototoxicity in live samples.
Dark noise
- Uncertainty in the photon-to-electron conversion process.
- Generated by thermal electrons in the camera sensor even in the absence of light.
- Also governed by a Poisson distribution.
- Becomes a problem for long exposure such as in bioluminescence imaging.
- Temperature-dependent: can be reduced by cooling the camera sensor.
Read noise
Resource
https://andor.oxinst.com/learning/view/article/sensitivity-and-noise-of-ccd-emccd-and-scmos-sensors
- Uncertainty in the electronic readout process of the camera
- Inherent to the process of converting CCD charge into a voltage signal and the subsequent analog-to-digital conversion
- added uniformly to all pixels
- Can be reduced by using a camera with low read noise specifications and optimizing the readout settings
- Read noise is negligible in high signal applications
- EMCCD: signal amplification happens before readout, so read noise is effectively reduced to near zero, making EMCCD ideal for low-light imaging.
| CCD | EMCCD | sCMOS | |
|---|---|---|---|
| Read noise | 2-6 e- | <1 e- | 1-2 e- |
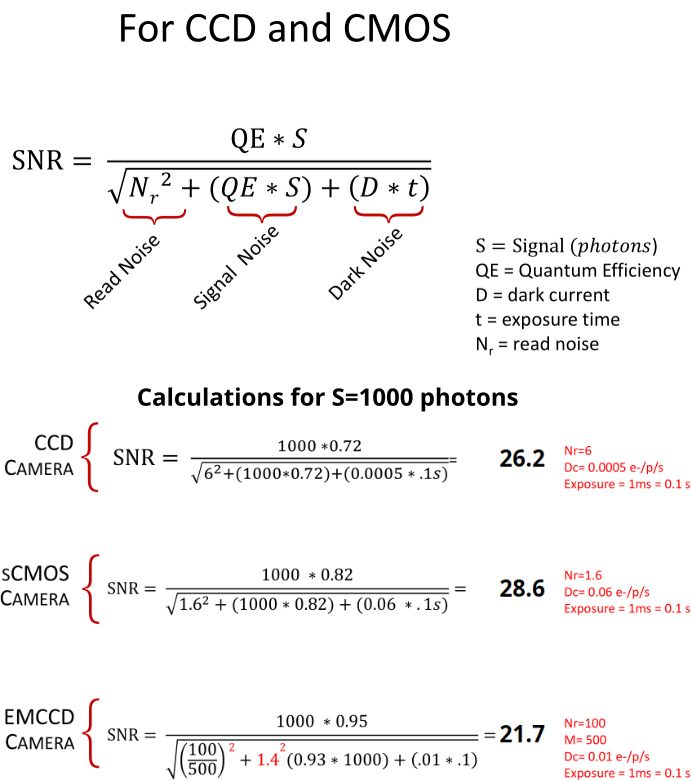
Signal-to-noise ratio (SNR)
- SNR measures the strength of the signal relative to the noise in an image.
- SNR is dependent on the input light levels and camera specifications (QE, various sources of noise etc.)
- Noise is not the same as background
- Noise: random corruption of any image due to inherent uncertainty of photon detection
- Background: any detected signal that is biologically non-informative
 Source: Hamamatsu white paper
Resource
Checkout SNR of different cameras under various conditions:
https://www.hamamatsu.com/sp/sys/en/camera_simulator/index.html
Resources - camera websites

Why should I learn about images and analysis in an era of AI and Deep Learning?
https://forum.image.sc/
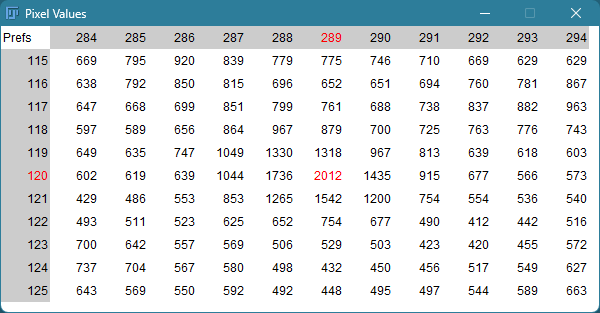
Images as pixels
Sharma et al. 2021, PMID: 34205257
- Images are composed of a grid of pixels
- Each pixel contains intensity information
Bit depth
- Number of available grey levels used the represent the signal intensity
- Determines how “finely” the signal is slices into discrete intensity levels
- Number of bits (N) determine the range of intensity levels
| Image Type | Range of intensity levels (0 to 2N-1) |
|---|---|
| 8-bit | 0-255 |
| 16-bit | 0-4095 |
| 32-bit | 0-65,535 |
| RGB color (3 x 8 bits) | 0-255 per channel |
| Bit depth (N) | # shades (2N) | Lookup table (LUT) |
|---|---|---|
| 1 | 2 |  |
| 2 | 4 |  |
| 3 | 8 |  |
| 4 | 16 |  |
| 5 | 32 |  |
| 6 | 64 |  |
| 7 | 128 |  |
| 8 | 256 |  |
How do grey intensity values relate to photons
Resources
https://www.teledynevisionsolutions.com/learn/learning-center/imaging-fundamentals/camera-gain/
https://www.teledynevisionsolutions.com/learn/learning-center/imaging-fundamentals/camera-sensitivity/
https://www.azom.com/article.aspx?ArticleID=20215
Intensity values/grey levels/Analog-to-Digital Units (ADU) are proportional to the number of photons detected by the camera sensor
- Convert grey levels to electrons \[\text{Photoelectrons} = (\text{Grey levels} - \text{Offset}) \times \text{Gain}\]
- Convert electrons to photons \[\text{Photons} = \frac{\text{Photoelectrons}}{\text{QE}}\]
need to know the camera offset, gain and quantum efficiency (QE) of the camera sensor for the specific wavelength
Resource: preparing images and describing image analyses for publication


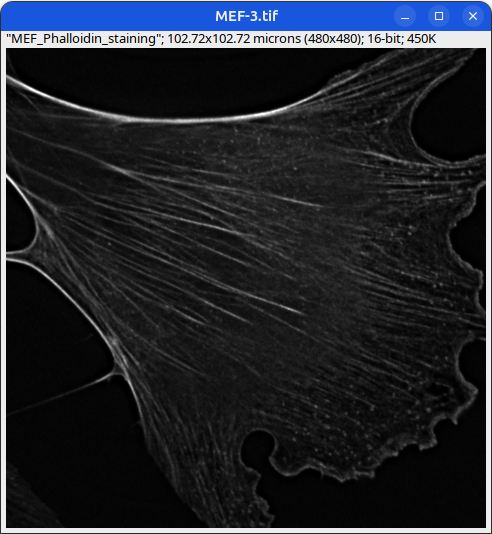
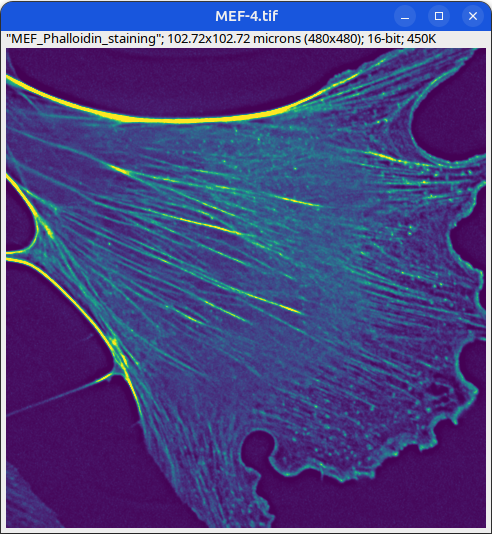

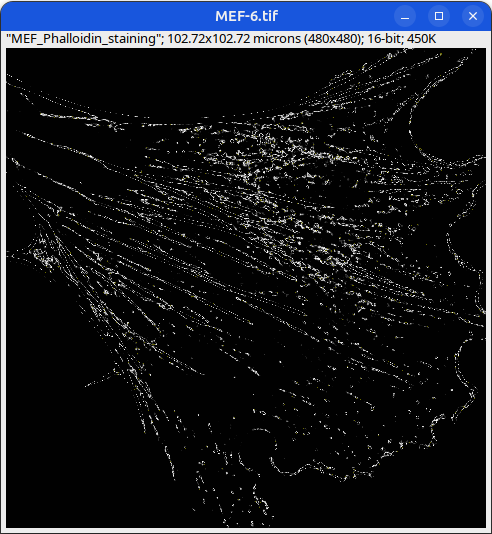
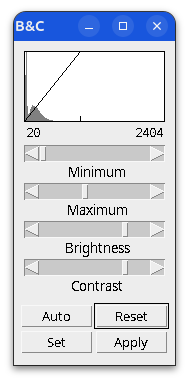
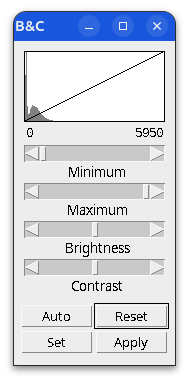
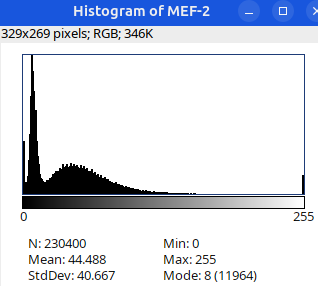
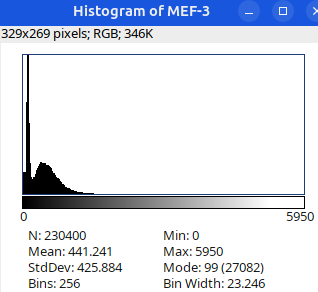
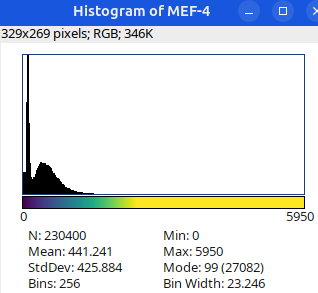
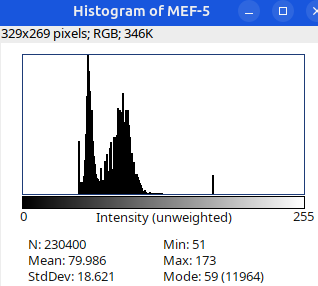
Brightness and contrast settings are different for the two images, but the pixel values are identical.
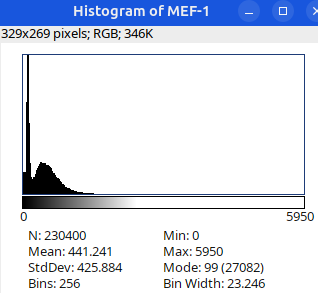
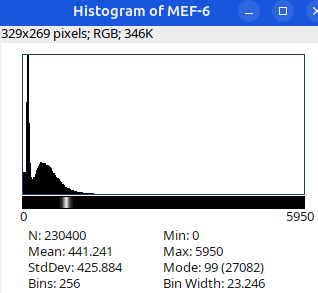
Next: let’s checkout the histograms of all 6 images. In Fiji, go to: Analyze > Histogram (or Press H)
Changing image bit-depth
Why would you want to change the bit-depth of an image?
- to save space (rarely)
- Because a particular ImageJ/Fiji plugin only works with 8/16/32-bit images (most common reason!)
- so that a large image could be completely loaded into RAM for quick visualization.
in Fiji, go to Edit > Options > Conversions...
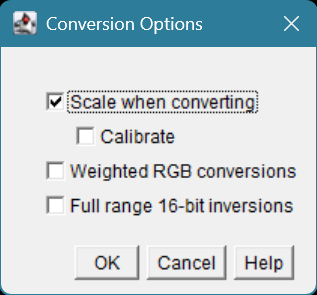
By default this setting is checked ON.
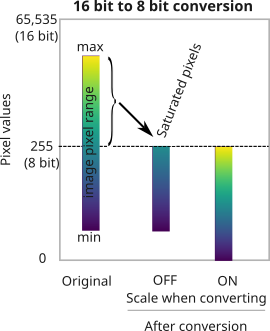
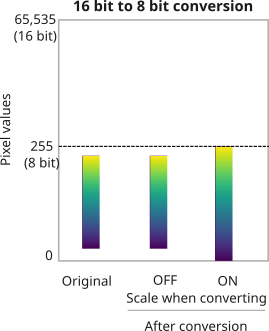
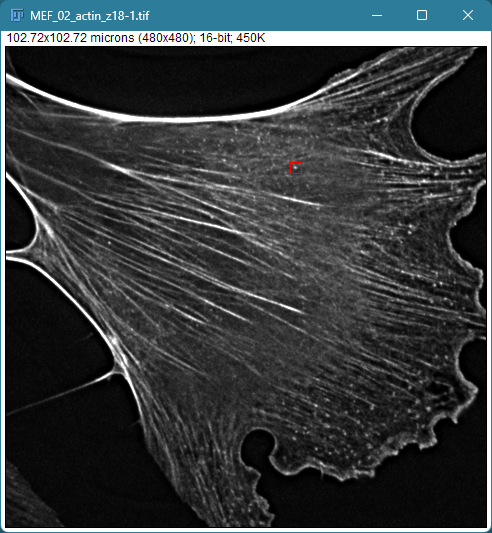
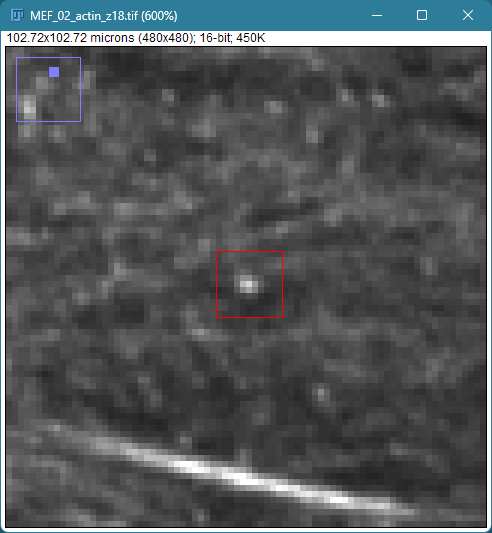
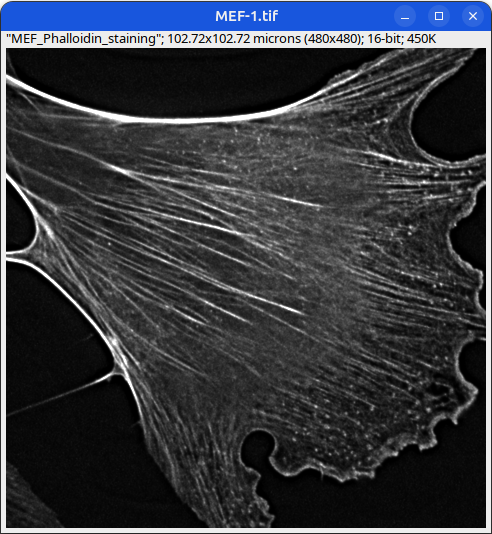
Image Metadata
Some metadata is displayed under the image title. 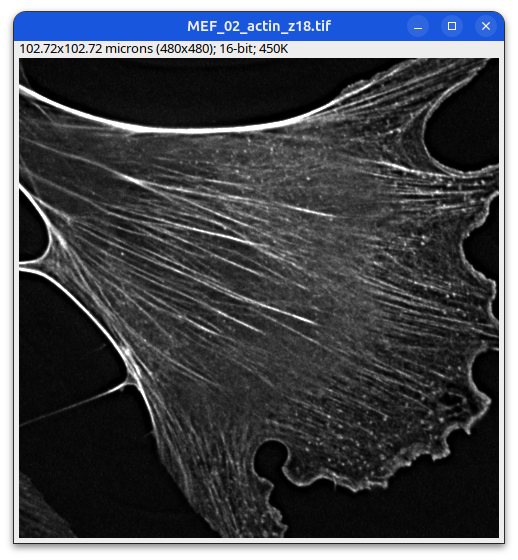
Mouse embryonic fibroblast stained with Phalloidin
A bit more metadata could be found under:
Image > Properties
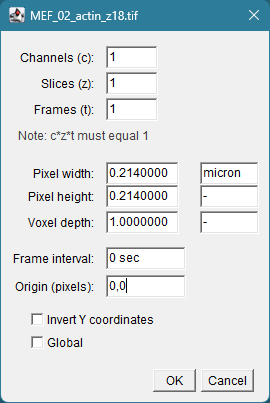
Image Metadata (detailed)
Plugins > Bio-Formats > Bio-Formats Importer 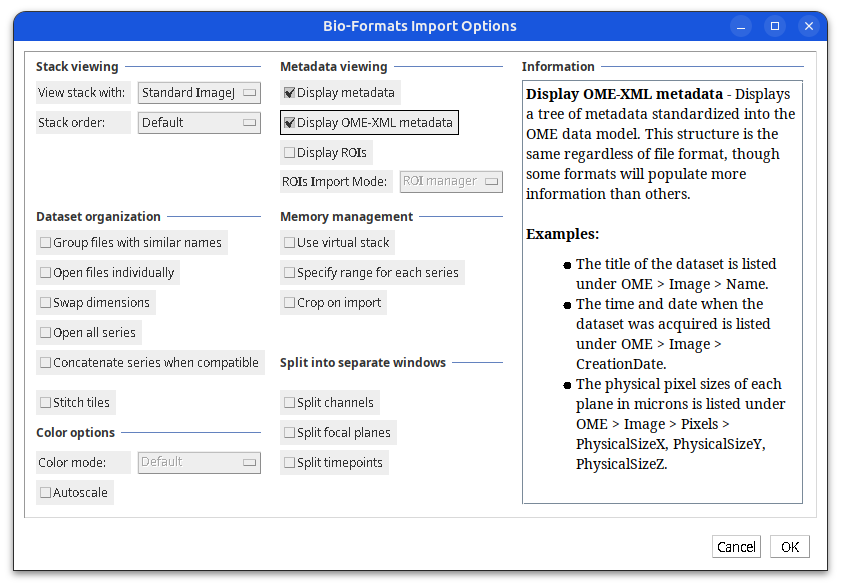
Image Metadata (detailed)
metadata as key/value pairs
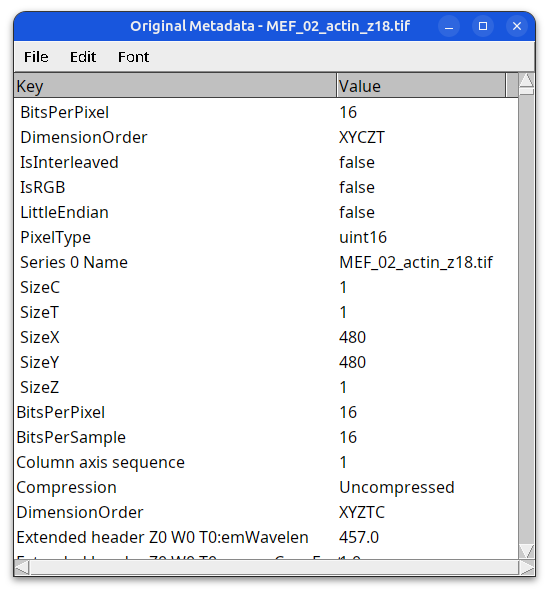
Image Metadata (detailed)
metadata in OME-XML format 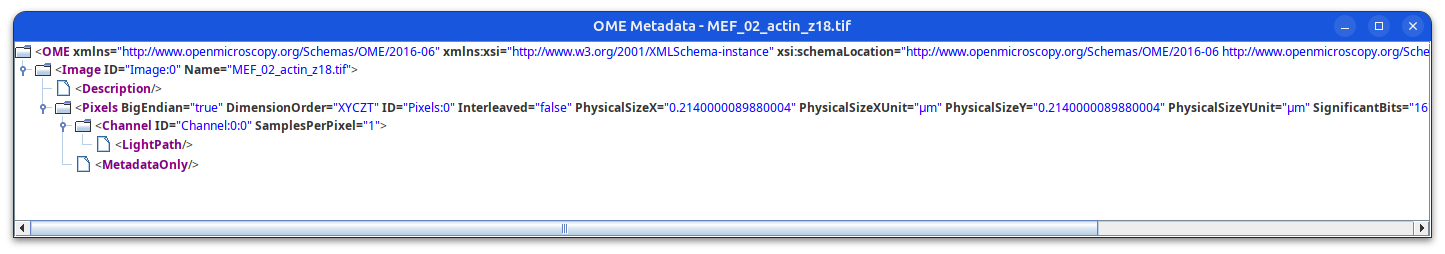
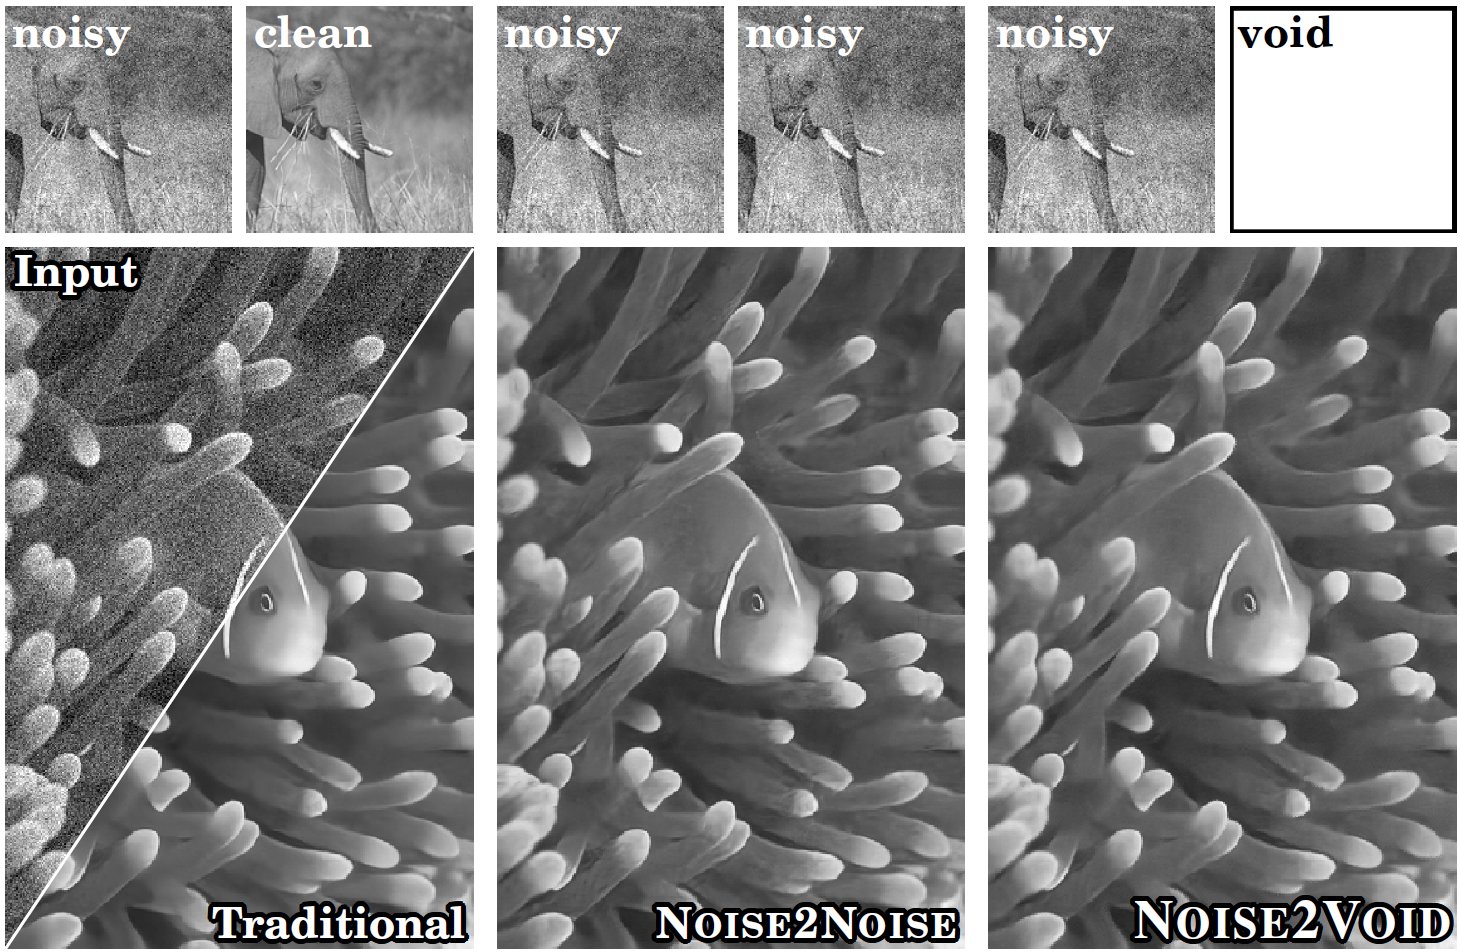
Noise reduction: AI-Denoising
- Various AI-denoising methods have been developed by training deep learning models on:
- pairs of noisy (low SNR) and clean (high SNR) images
- CARE (Content-Aware Image Restoration)
- RCAN (Residual Channel Attention Networks, from AIVIA)
- pairs of noisy images - Noise2Noise (N2N)
- Single noisy images - Noise2Void (N2V)
- pairs of noisy (low SNR) and clean (high SNR) images
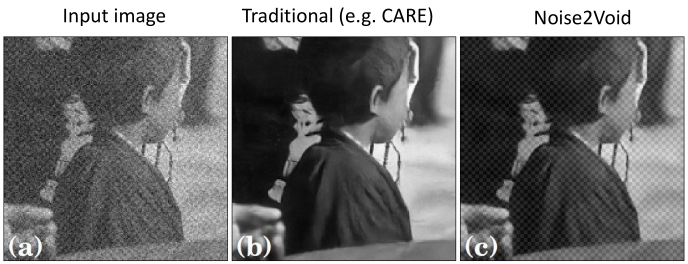
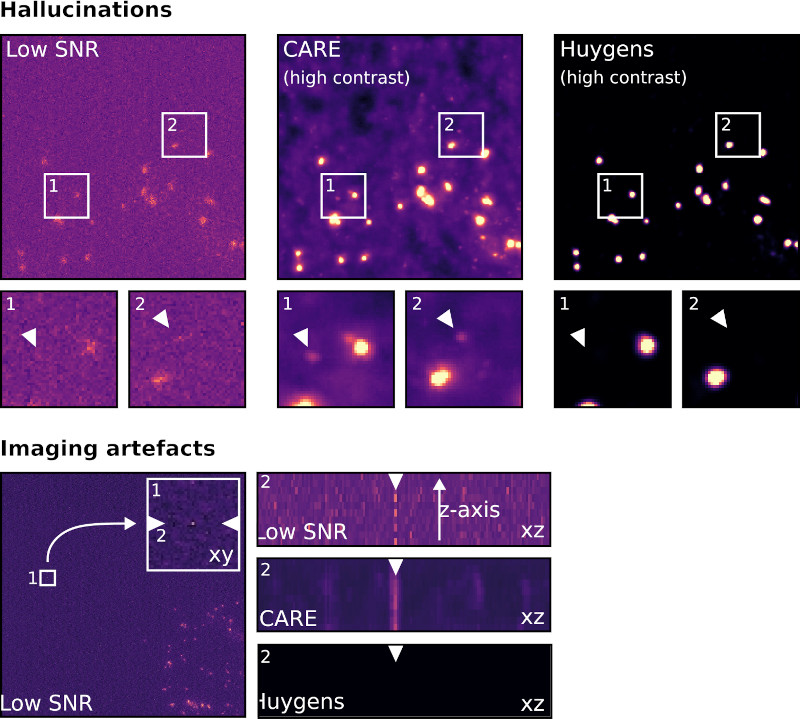
- Problems with AI-denoising:
- AI can create, alter, or hallucinate features that do not exist in the raw data, producing images that look realistic but are scientifically inaccurate.
- Resource-intensive: model training requires hundreds to thousands of paired (noisy/clean) images to train effectively
- Some methods such as Noise2Void fail to remove structured noise
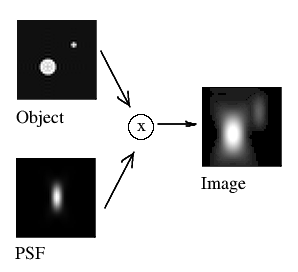
concept of deconvolution https://zeiss-campus.magnet.fsu.edu/articles/basics/psf.html
Noise reduction: Deconvolution
- A mathematical operation that reverses the effects of convolution (blurring due to out of focus light) in an image, using the point spread function (PSF) of the imaging system.
- Does not require deep learning model training, so it is less computationally-intensive than AI-denoising
- It does require accurate estimation of the PSF for optimal results.
- Deconvolution can improve image resolution and contrast without introducing hallucinations, as it is based on the physical properties of the imaging system rather than learned patterns from data.
- Overall, Deconvolution is a more reliable method for noise reduction in microscopy images compared to AI-denoising.
Resource
https://svi.nl/AI-Image-Denoising